FFT analysis
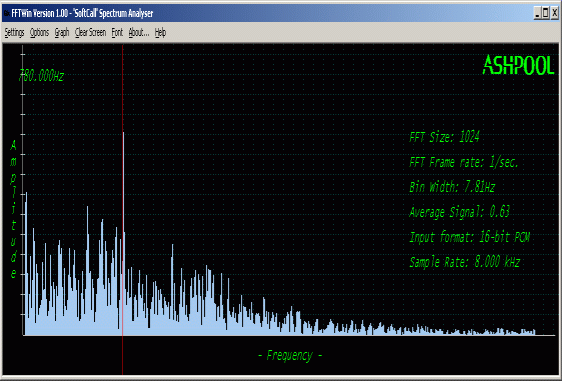
If the streak was caused by an insect, its wing beat should show up as a slight periodicty in the pixel strips immediately adjacent to the trail (the 'wings' being apparent above and below the object at right in the above images). Because the shutter speed is 1/20th second and insect wings beat between 50Hz and 2KHz, there would be betteen 2.5 and 100 wing beats along the trail. In practice, as the insect can't be that small (else it would be completely out of focus) and appears to be fly or bee-like, a reasonable estimate would be 100 to 200Hz. To attempt to detect this periodicity, an FFT was run along the image trail and the results graphed as shown below.
Click on the image for a larger version.
To create this image, a 1024-pixel strip of horizontal pixels parallel to and just above the streak was extracted, windowed with the hamming function and fed into a 1024-point FFT. A sine wave was also mixed into the data at -16.0dB in order to act as a marker and to verify correct operation (indicated by the red line).
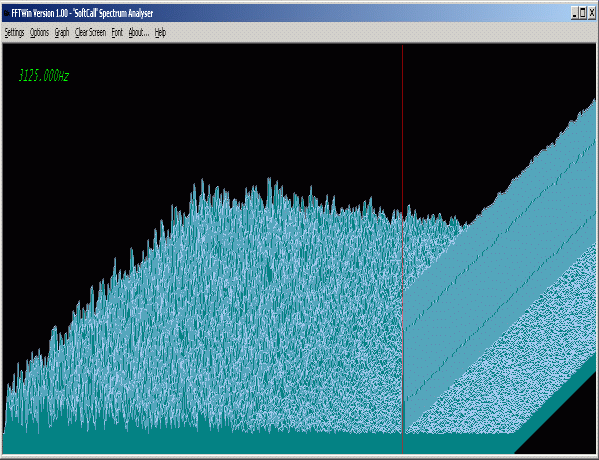
As an addendum to the above image, which was created from a single strip of pixels, I also compared the outputs of the FFT's for 200 separate 1024-pixel strips centred across the trail.
Click on the image for a larger version.
In this image, front-to-back represents a section of the image at right angle across the trail, 200 pixels wide, while left to right represents increasing frequency (from DC to about 11.5KHz).
The obvious spike is an injected test signal used to verify operation of the signal processing chain (equivalent to a superimposed grid of vertical bars spaced about 2.5 pixels apart), and as is apparent there's no visible correlation between the peaks in the FFT outputs (which is what you'd expect to see if a periodic signal was present from the wings - two 'humps' should appear either side of the centre line, probably close to the left edge as this represents lower frequencies).
In other words, if there's a periodicity in the pixels adjacent to the trail caused by the insect's wings, it's buried too deep in the noise to be easily detectable.
FFT analysis (additional)
On the discussion forum, victorengel suggested subtracting the FFT for a strip outside (but near to) the wing shadow area from the FFT(s) of strips inside.
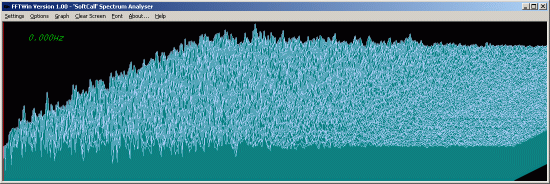
The pseudo-3D image shown below was created this way. Front-to-back is a 200-pixel line perpendicular to the trail, while left-to-right represents increasing frequency.
(click image for larger version)
As before, nothing too obvious, note though that (as would be expected) the general 1/F shape has been removed from the image.
Now, if a periodic signal is present, it's possible to get additional gain by summing the frequency bins; the noise will average out, but the periodic signal will reinforce (even if the phase of the signal varies between the strips because of a changing wing sweep, this won't affect the FFT result - unlike attempting to isolate the wings by vertical summing of pixel columns, in which case phase would matter).

(click image for larger version)
Still, there is no obvious indication of a periodic signal. There does appear to be a roll-off at low frequencies in excess of 1/f, but it's unlikely that's significant - possibly the baseline FFT happens to have a slight rise at low frequency (due to clouds?) and as this is subtracted from all others, it appears as a bias in the other direction.
FFT Verification and experimentation
To verify the FFT approach and confirm it really would detect a wing beat, I started with an image with an obvious periodic component (taken from this webpage about 'Hot-rods'). Here's the extracted image, rotated so the trail is horizontal (the vertical 'rods' are the 5 wing beats that took place during the exposure).

Performing separate FFT's on each strip of pixels and displaying them in pseudo-3d gave the following result, in which the wing beat frequency stands out very clearly.
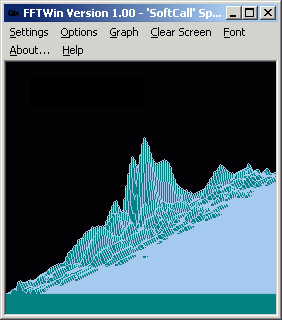
Naturally enough, summing the FFTs that went to make up this image gives an extremely strong signal; having scaled the spike height to stay on-screen, the noise is completely suppressed.
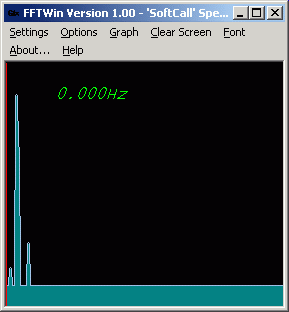
The 3D FFT of the image trail from the APOD picture can be seen higher up on this page (or here), so now here is the sum of the FFTs from that image:-
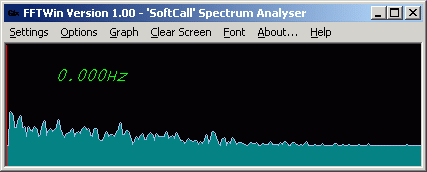
There certainly doesn't appear to be any sign of a periodic signal - which doesn't mean it's not there, of course, it may just be buried too deep in the noise to be detectable.
Feedback? Send email to hapod<at>hazeii.net