Determining the shape of the trail (Initial - see also Final)
Although the trail appears at first sight to be straight, careful examination shows slight deviations. In order to quantify this and to get a better idea of the true shape a procedure to track the centre of the trail was devised.
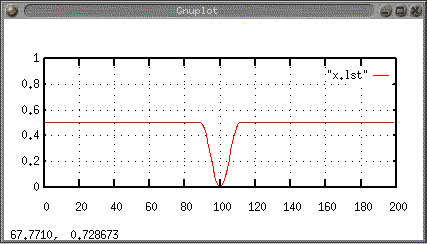
Noting that a cross-section across the trail reveals a roughly U-shaped dip in the intensity, the procedure operated by finding the best fit (minimum least-squared error) between this dip and a reference template approximating the shape of the dip.

Reference template
The template was then compared with a 1250-pixel-long strip in the direction of the trail, starting just before it and ending just after the object. At each pixel position along the strip, the location of the pixel with the best fit was recorded.

Click on the image for a larger version.
In the above image, the background image shows the image and the trail, rotated so that the trail is horizontal. The best-fit positions are marked out with white dots, and it can be seen that these track the trail along its length (except at the extreme left and right sides of the image, which fall outside the trail.
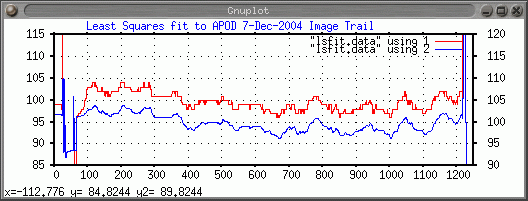
Graphing the output data and stretching the vertical scale reveals the fine detail - on the graph below, the red line is drawn through the pixel positions selected by the algorithm while the blue line is a smoothed version of the same.

Click on the image for a larger version.
Features of note are that the general shape of the curve corresponds well to the general shape of the curves in the horizontally-compressed images, and that there appears to be a semi-periodic variation in the centreline position (corresponding to a body wobble, and at a frequency that's in the ballpark for a wing beat - 125 pixels ~= 184Hz). Also note the curve matchs well with the observation that the first half of the trail is quite linear, while the second half appears to show a tightening curvature.
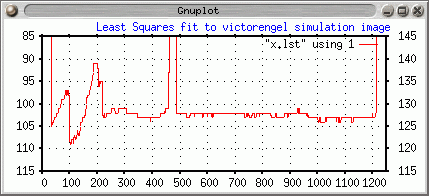
Finally, in order to test the validity of the result, the same procedure was executed using an image with a simulated trail contributed by victorengel. The resultant graph is shown below - note both the linearity of the graph, and the absence of semi-periodic variation (the increased variation at left is because the simulated trail is shorter than the actual one, and starts at x=~220).

Click image for larger version.