Determining the shape of the trail (Final - see also Initial)
Following on from the earlier work aimed at determining the exact shape of the trail, although this proved the trail is not straight there was still a question whether the semi-periodic variation that appeared to be present was really present in the original trail, or an artefact introduced in the various image scaling, rotating and other processing that was performed as part of that work.
To check this, a program was developed that could add a simulated streak to the original image, approximately parallel to it and of the same profile and density. As the simulated trail is mathematically straight and close to the original trail, it acts as a control; if the periodic variation is an artefect it would be expected to appear in the simulated trail also.

Original image, with simulated streak (Click to enlarge)
To check the simulated trail was a reasonable approximation of the actual trail, cross-sections were taken across the two trails and averaged. A plot of the resultant intensity profile is shown below; the first minimum (X~=63) is the simulated trail and can be seen to be a reasonable match to the second minimum (X~=112) which is the actual trail.
Intensity profile of cross-section across simulated and real trails.
The best-fit was then found to both trails, by finding the least-squared difference between the actual trail and a reference template approximating the intensity drop. Effectively, the reference template was slid down each trail one pixel at a time and shifted from side to side and the point of minimum difference recorded. The data points were then plotted onto the image, with an X4 scaling factor to highlight deviations from the theoretical 33.6 degree centre-lines (yellow).
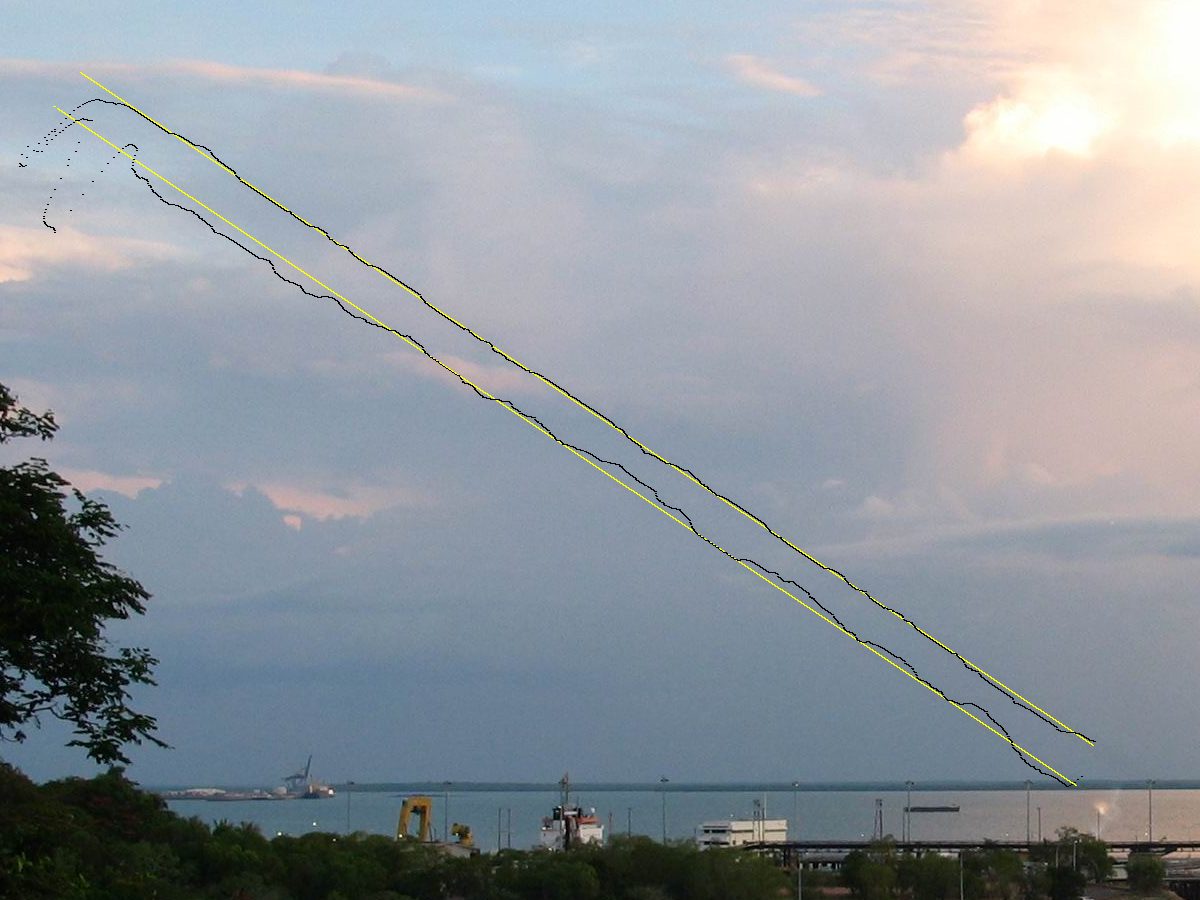
Best-fits to actual (lower) and simulated (upper) trails, scaled x4 (Click to enlarge)
As can be clearly seen, the fit to the actual trail shows both long-term deviation away from its average centreline (yellow) as well as semi-periodic variations with a frequency corresponding to about 200Hz. By contrast, the fit to the simulated trail closely tracks the centreline, with deviations from it being both small and apparently random (the extreme deviations at the left end of the lines are because the trails do not extend that far).
For source code (apod-0.0.2.tgz) and other information regarding this work, please see the main index and the Methods and Materials page
Feedback? Send email to hapod<at>hazeii.net